Construction Dewatering in Northern Province Chalk
WJ Whitepaper
Publication Credentials
AUTHORS:
T.O.L. Roberts (WJ), G.J. Holmes (WJ) and M.A. Lee (Atkins)
- WJ Groundwater Ltd, London, UK
- Atkins, Leeds, UK
DATE: 2018
Abstract
This case study provides a rare insight into the hydrogeology of Northern Province Chalk Group. Installation of a new 6 km services pipeline under the Humber Estuary required the construction of a launch pit and a reception shaft for the TBM drive each side of the estuary. This paper covers the design and performance of the temporary works groundwater control arrangements used to facilitate excavation of the launch pit and associated ramp structure. The launch pit is located on the estuary south bank and was founded in the chalk aquifer in an area where groundwater is already fully committed for water supply.
Preliminary studies suggested the likely presence of a superficial horizon of potentially highly permeable chalk „bearings‟ (clast dominated frost shattered chalk) which are a feature of the Northern Province Chalk Group. A pumping test was undertaken which was designed to investigate the variation in chalk permeability with depth and the practicality for recharge.
The groundwater control arrangements for the launch pit included a partial cut-off to control inflow from the chalk „bearings‟, abstraction from an array of internal chalk wells and recharge of the pumped groundwater to the chalk aquifer via external recharge wells.
Introduction
A new high pressure gas pipeline is being construct- ed between Goxhill, on the south bank of the Humber Estuary in North Lincolnshire, and Paull, on the north bank in the East Riding of Yorkshire. The pipe- line route includes a new 5 km bored tunnel under the Humber Estuary through which the pipeline pass- es. A launch pit at Goxhill and a reception shaft at Paull were required for the TBM drive. This paper covers the design and performance of the temporary works groundwater control arrangements used to facilitate excavation of the launch pit and associated ramp structure. The site layout is shown in Figure 1.
The site was previously agricultural land with a ground level of approximately 2 mOD. The launch pit was to be primarily excavated in superficial glacial soils, which act to confine groundwater in the underlying chalk, although at its deepest point the excavation extended into the upper portion of the chalk. Groundwater levels monitored in the chalk prior to the works were typically around 1 mAOD. Preliminary studies suggested the likely presence of a thin horizon (up to 5 m) of potentially highly permeable chalk „bearings‟ (clast dominated frost shattered chalk), which are a feature of Northern Province Chalk Group, immediately below the superficial de- posits. The launch pit was 80 m long by 7 m wide, narrowing to 5 m, with an associated ramp structure 48 m long by 5 m wide. The maximum dig depth was 11.2 m, with a formation level between -3.8 mOD and -9.2 mOD. The launch pit had side support com- prising secant piles extending to 19 m AOD and sheet piles extending to 17.6 mAOD. Following excavation a base slab was cast to accept full hydrostatic loading, effectively isolating the launch pit from the groundwater regime and allowing cessation of pumping. A cross section through the launch pit is shown in Figure 2.
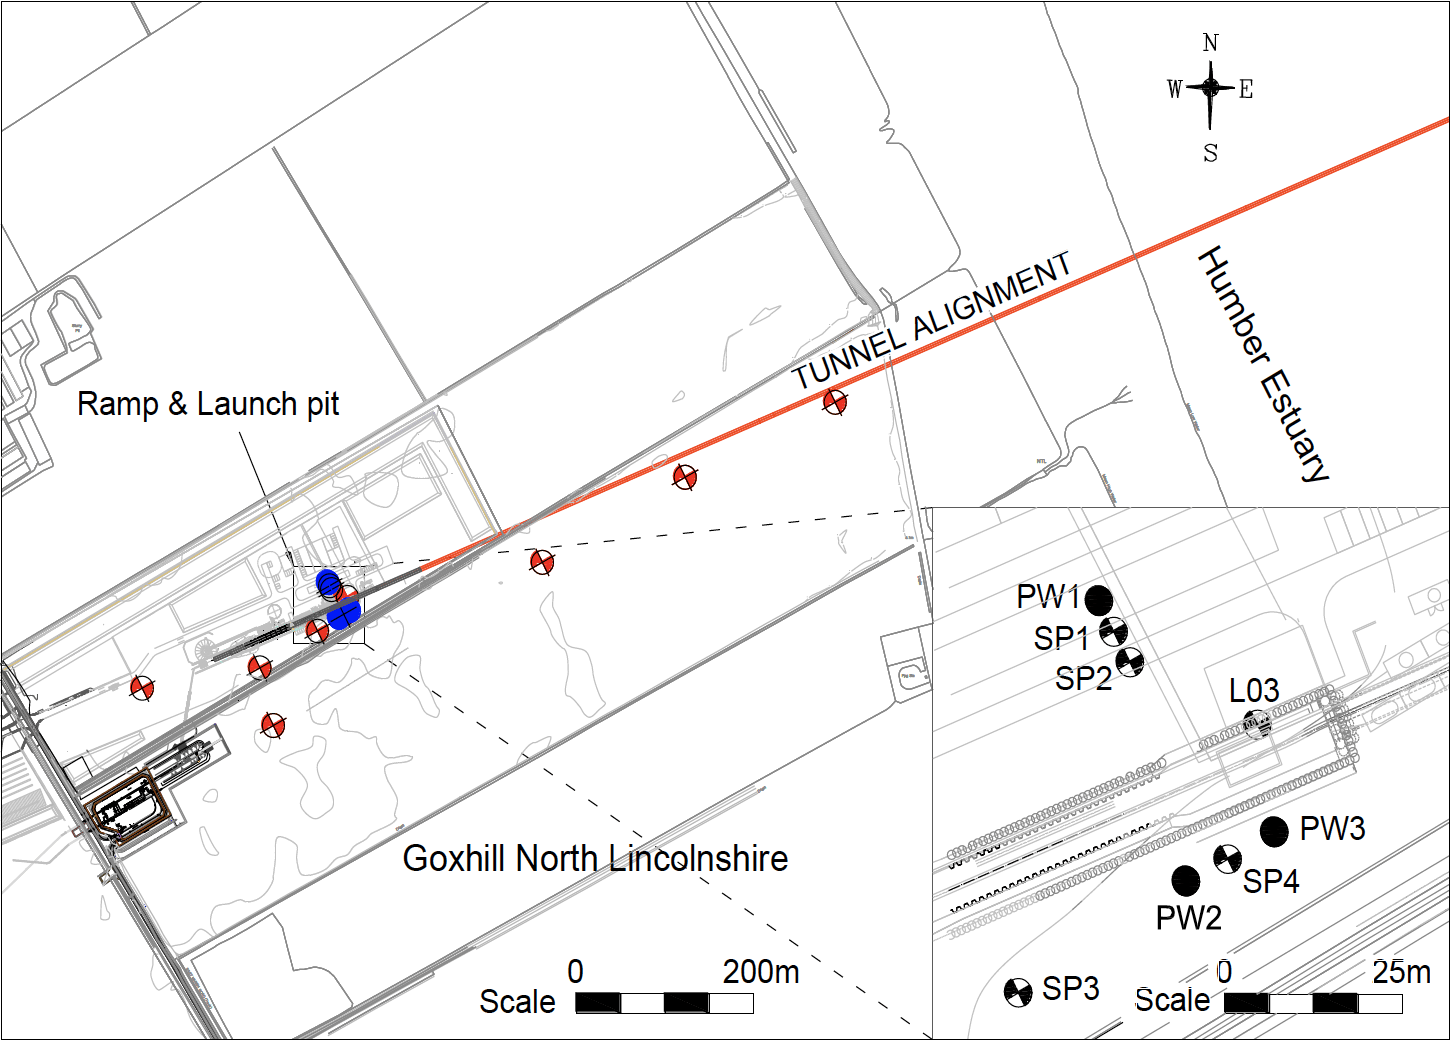
Figure 1. Site layout showing site investigation borehole locations and pumping test layout.
A groundwater control solution comprising a partial cut-off with internal pumping wells was developed to reduce upward pressure from the chalk and facilitate the excavation of the launch pit.
The site was subject to a number of environmental constraints that informed the design of the groundwater control system. The chalk in North Lincolnshire was classified as “fully committed” by the Environment Agency under their Catchment Abstraction Management Strategy meaning pumping to a surface discharge point was not viable. Additionally, the proximity to the Humber Estuary, which presented a risk of inland migration of the saline interface, and the presence of a nearby private supply borehole necessitated the use of external re-injection wells to minimise the drawdown in water levels outside the launch pit.
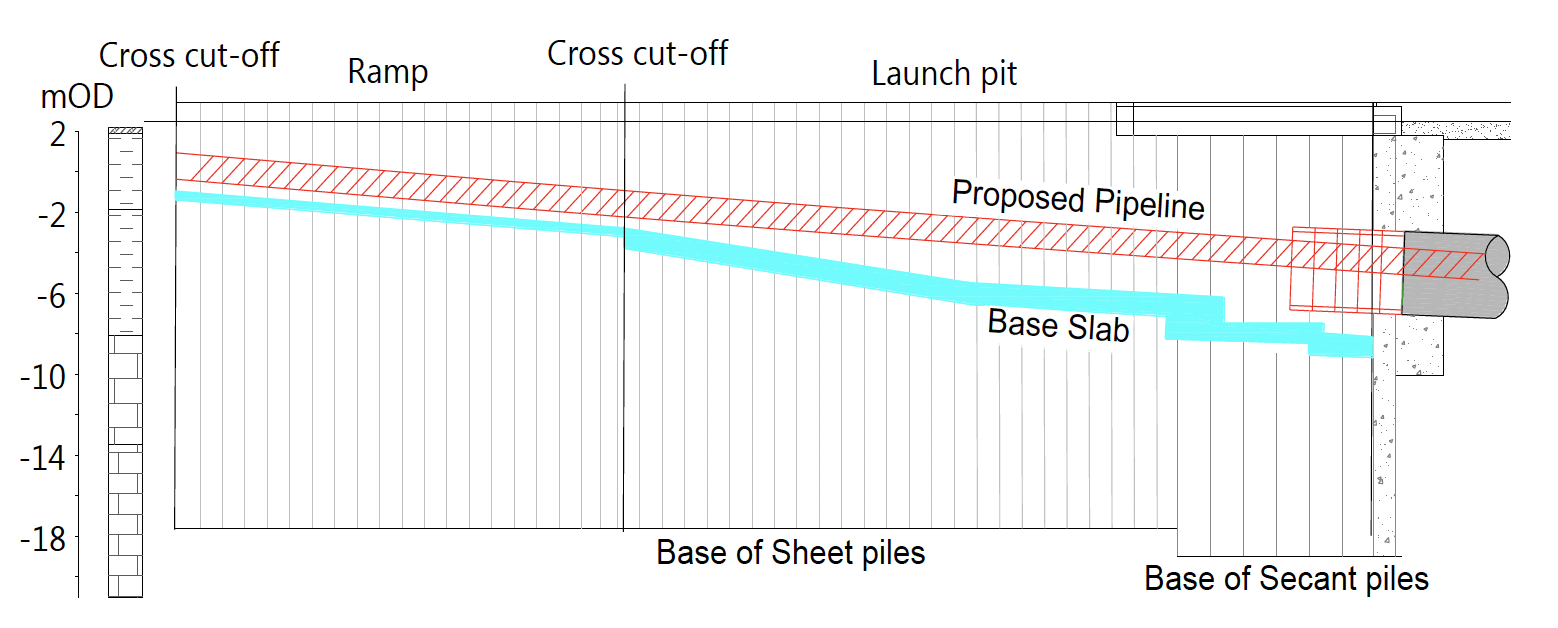
Figure 2. Cross-section through structure showing general soil profile and proposed cut-off.
A further consideration was the driveability of sheet piles in the relatively dense Northern Province Chalk Group. In order to achieve a suitable barrier to flow, the piles needed to be driven without causing disturbance at the pile toe, which would create preferential pathways. Vibratory driving of the sheet piles was deemed viable following review of the available ground investigation information. This proved to be the case, with only a small fraction of the piles refusing just short of the design depth and no indication of damage to the chalk below the toe of the pile leading to the development of preferential flow paths.
A pumping test programme was carried out to un- derstand the variability of hydraulic conductivity with depth. The pumping test results were used to de- termine the required target depth for the internal pumping wells, and the required drive depth for the piles to key into the competent chalk underlying the chalk bearings.
Ground Conditions
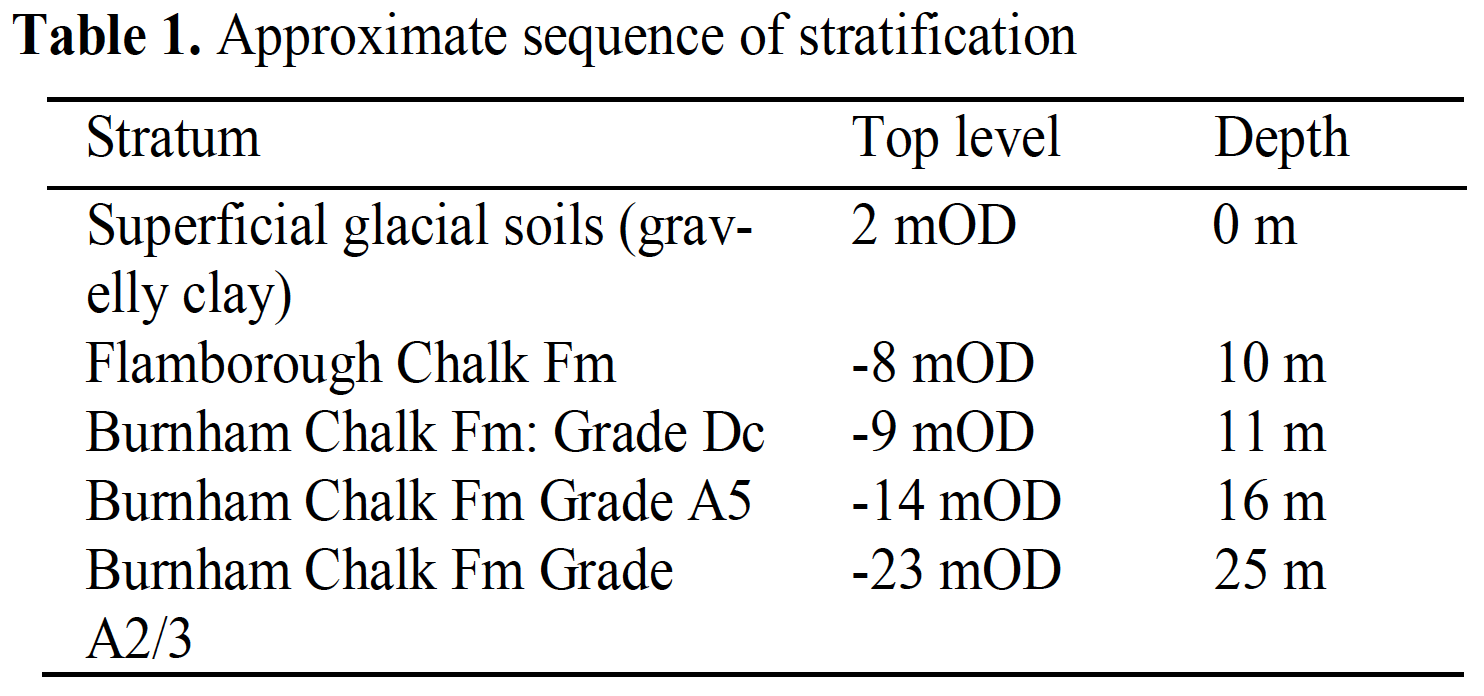
The site investigation borehole logs indicated the sequence of stratification given in Table 1.
The glacial soils are predominantly cohesive and provide a confining layer to the chalk below.
At the site of the launch pit structure there is a thin layer of Flamborough Chalk Formation which was recovered as structureless chalk and generally de- scribed as weak medium to high density white chalk with extremely closely to closely spaced laminations of grey marl and some trace fossils with occasional black sponges.
Below this is a significant thickness of Burnham Chalk Formation which was graded more thoroughly. The top 5 m, approximately, was found to be structureless Grade Dc, (Lord et al, 2002), below this is approximately 9 m of Grade A5 chalk. Underlying this is an unproven thickness of Grade A3 chalk.
The chalk is water bearing with a standing groundwater level at approximately 1 mAOD, which is subject to modest tidal fluctuations of up to about 0.1 m at the site of the launch pit. As would be expected the tidal fluctuations increase towards the estuary to a maximum fluctuation of just less than 1 m in the chalk.
Pumping Test Design
Seepage flows into a cofferdam are largely controlled by the permeability at the toe of the retaining wall which in this case is the Grade A5 Burnham Chalk Formation, see Figure 2 and 3. There was also a requirement to recharge the abstracted groundwater which it was known from experience would lead to significant flow recirculation unless it could be shown that the cofferdam provided an effective cut- off for any superficial higher permeability chalk. It was clearly necessary to design the pumping test to investigate the variation in permeability with depth. In order to achieve this, a total of three wells were in- stalled with response zones at increasing depths as shown in Table 2 and Figure 3.
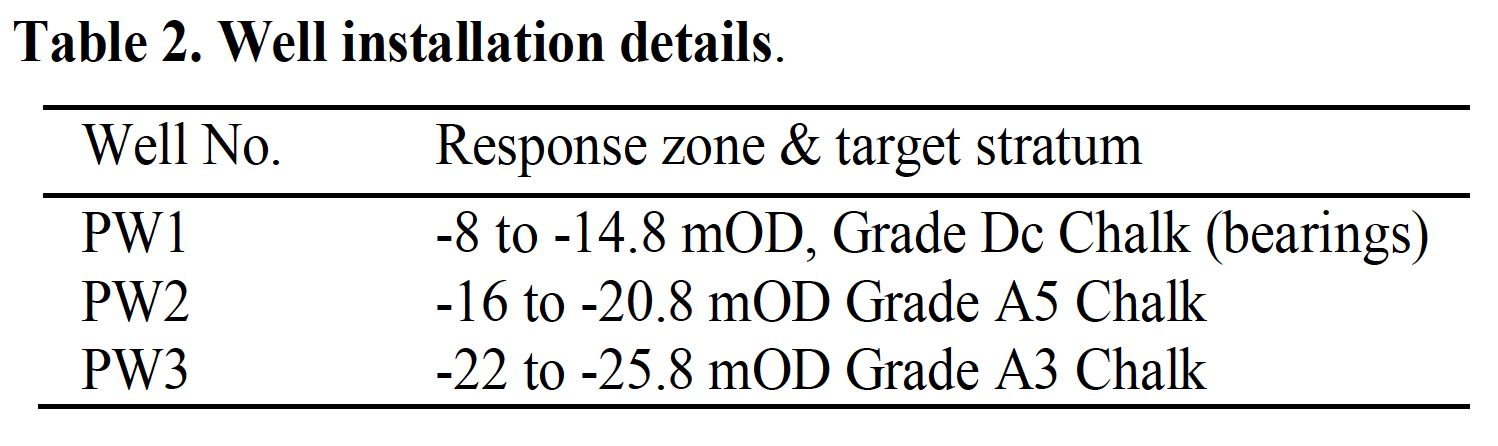
The shallow well PW1 targeted the superficial Grade Dc chalk bearings. PW2 targeted the horizon at about the design level of the retaining wall. PW3 targeted the high grade chalk below as a contingency measure in case the results from PW1 and PW2 indicated that a deeper cut-off was necessary. The response to the pumping was monitored in an array of existing and new piezometers, at varying distances from the pumped wells from 5 m up to 600 m.
The test programme involved step tests and 48 hour constant rate discharge tests on each well followed by a 72 hour abstraction recharge test. A log time plot showing the drawdown data from the constant rate discharge test is shown in Figure 4.
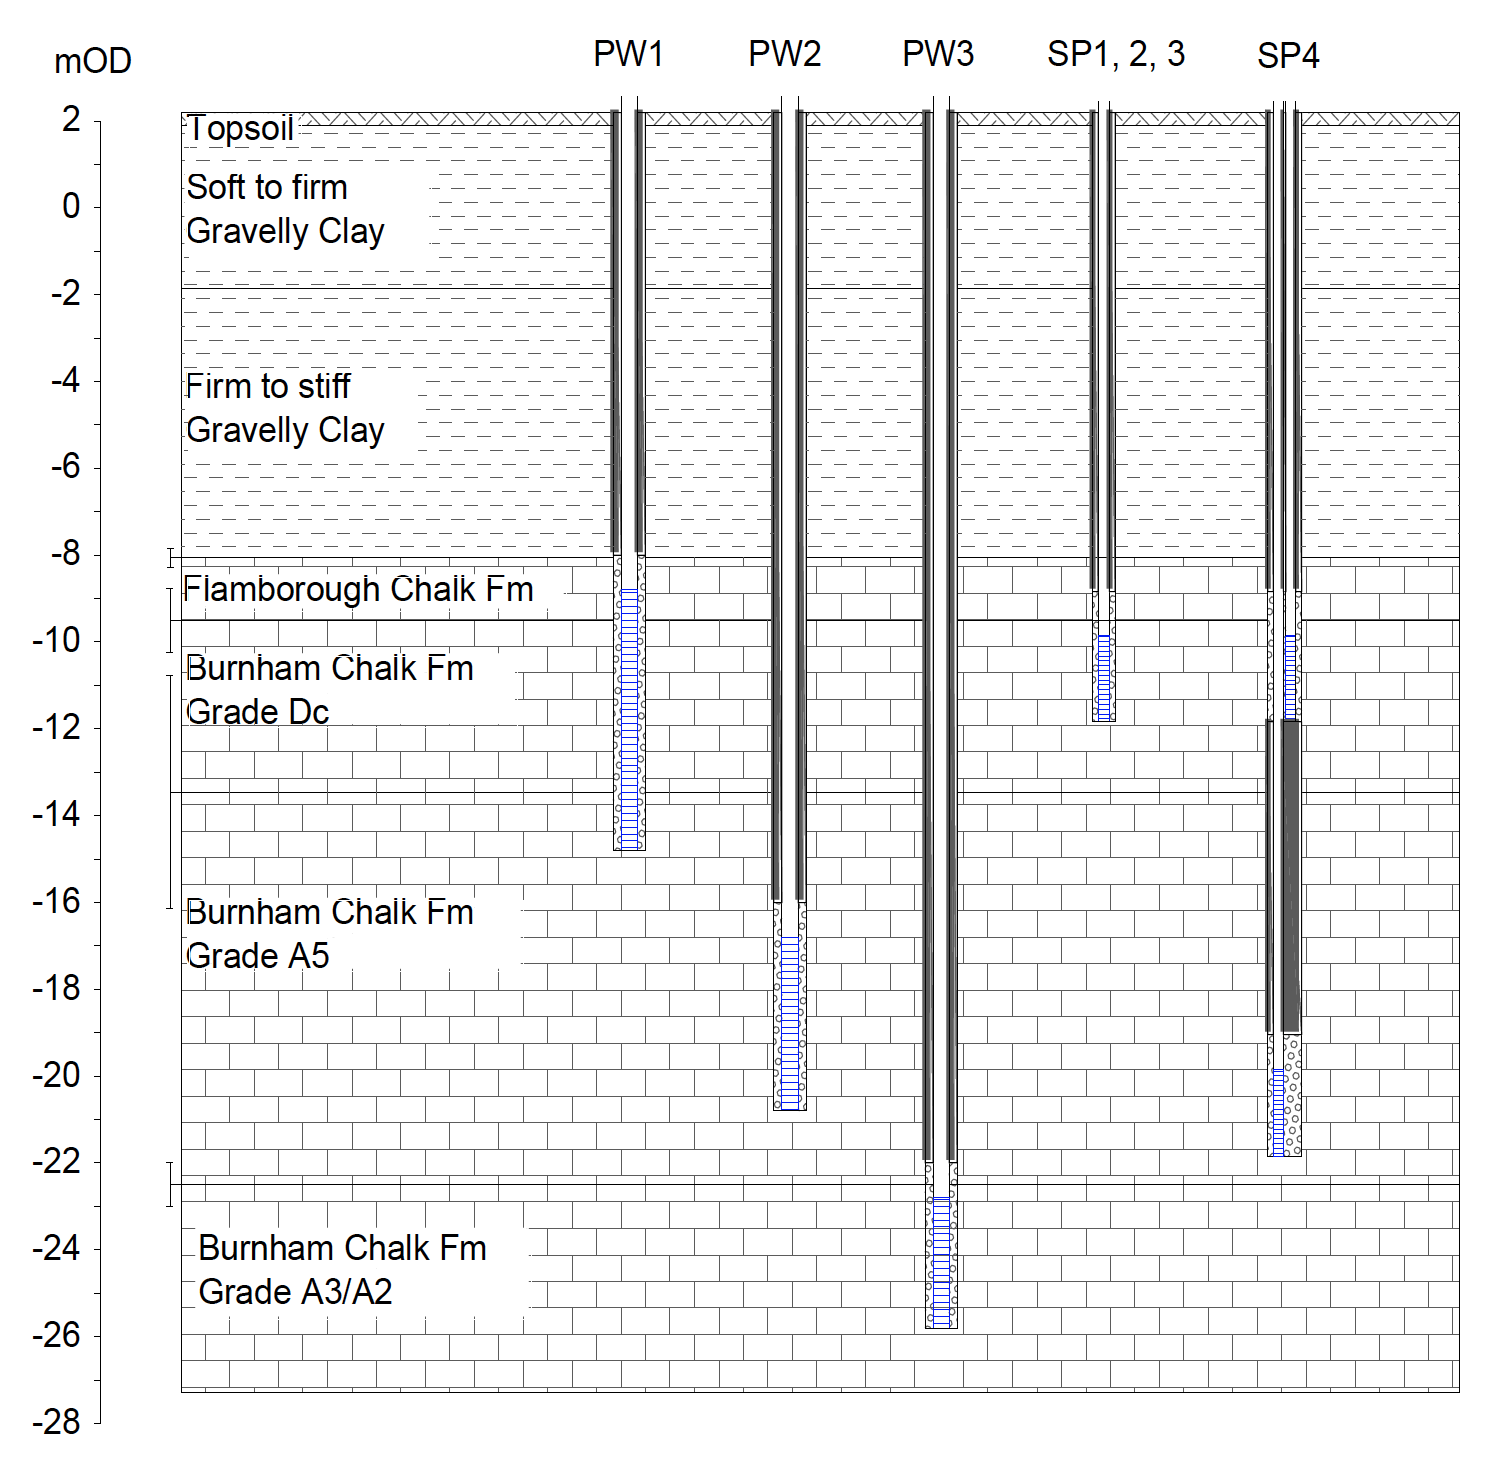
Figure 3: Ground profile and pumping test well piezometer response zones.
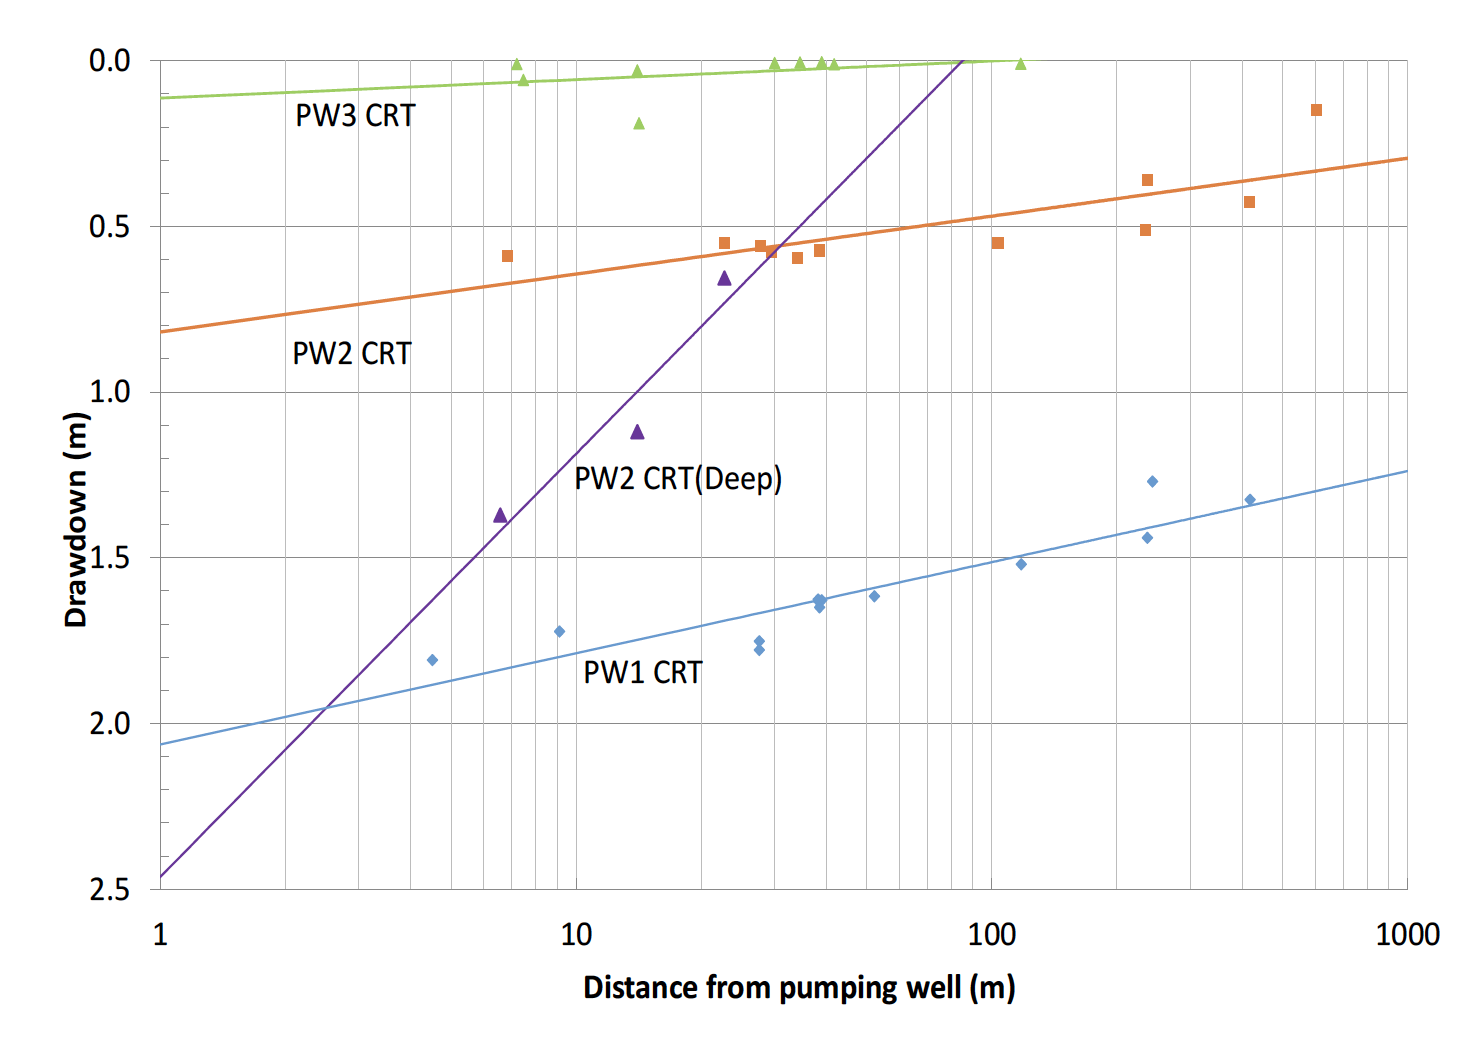
Figure 4: Results from constant rate discharge tests.
Pumping Test Analysis
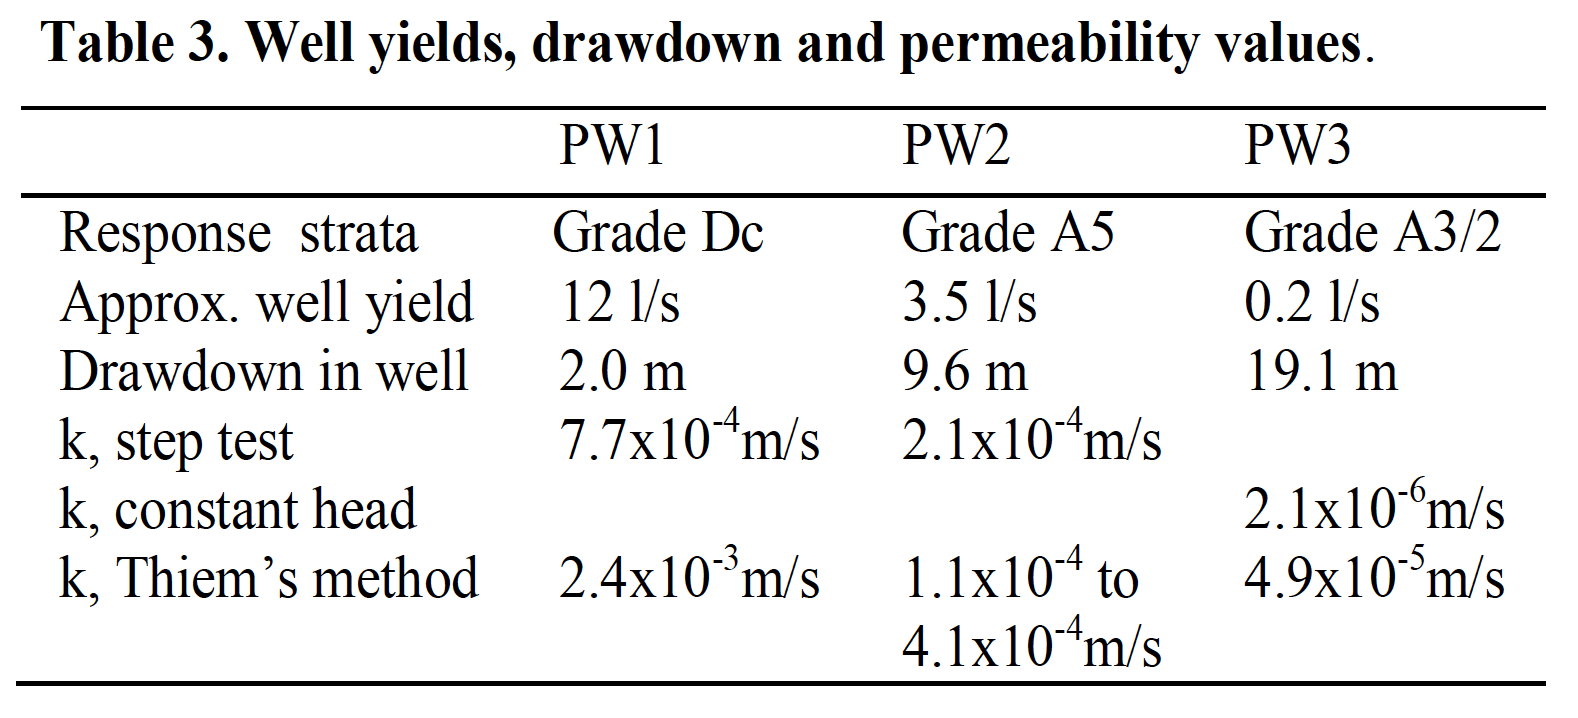
The step tests were analysed using the proprietary software package AquiferWin, and the constant rate tests were analysed using Thiem‟s method, see Kruseman and De Ridder (2000). The deeper well, PW3, screened in the Grade A3 chalk did not yield sufficient quantity for a step test to be undertaken. The yield and water level data from the well itself was therefore analysed as a constant head test using the procedures given in BS5930 (1999). The permeability, k, values obtained, the well yields and drawdown in the pumped wells are summarised in Table 3.
A range of permeability values were derived from the constant rate test on PW2. The semi-log distance drawdown graph, see Figure 4, revealed a markedly different response for piezometers within 20 m of PW2 screened in the Dc chalk to those screened at a lower level. Greater drawdown was achieved in the deeper piezometers with a response zone within the PW2 screen horizon and below. The response in the shallow piezometers is likely to be dominated by Dc chalk and gives a distance drawdown slope similar to that obtained when pumping from PW1. This result- ed in two different permeability values derived using Thiem‟s method as indicated in Table 3. The slope derived from the deeper piezometers was considered to provide a more representative value of the horizontal permeability of the A5 chalk.
The abstraction recharge test involved pumping from PW2 and recharging to PW1 at a flow rate of 4.5 l/s. This data was used to calibrate a numerical model as described below.
Numerical Model
Model Calibration
The values derived from a conventional single vertical well pumping test, as given in Table 3, are predominantly horizontal permeability values. Inflow to a cofferdam with retaining walls which penetrate to a significant depth below dig level, as in this case, is primarily controlled by the vertical permeability of the stratum in the vicinity of the toe of the cut-off. The Grade Dc chalk should be fully cut-off by the retaining wall. The inflow to the cofferdam during the construction works will then largely be controlled by the vertical permeability of the stratum at the retain- ing wall design toe level which in this case is the Grade A5 chalk targeted by PW2.
Calibration was carried out by setting the abstraction flow from PW2 at 4.5 l/s with recharge to PW1 at the same rate as in the test. Commencing with the lower permeability value derived from the PW2 distance drawdown data for A5 chalk, the permeability and kv/kh ratio were then modified to obtain a close match to the actual groundwater level data recorded during the test. Good correlation was obtained for the differing response of the shallow and deep piezometers installed at SP4. The final calibrated numerical model used the permeability values and ratios given in Table 4.
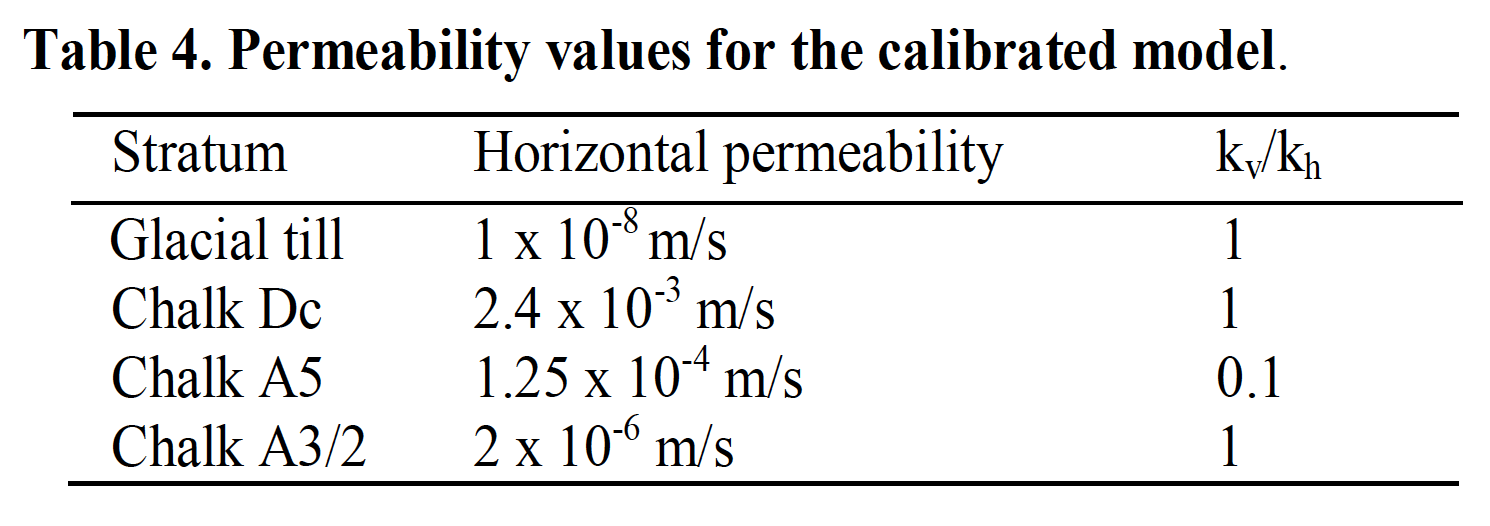
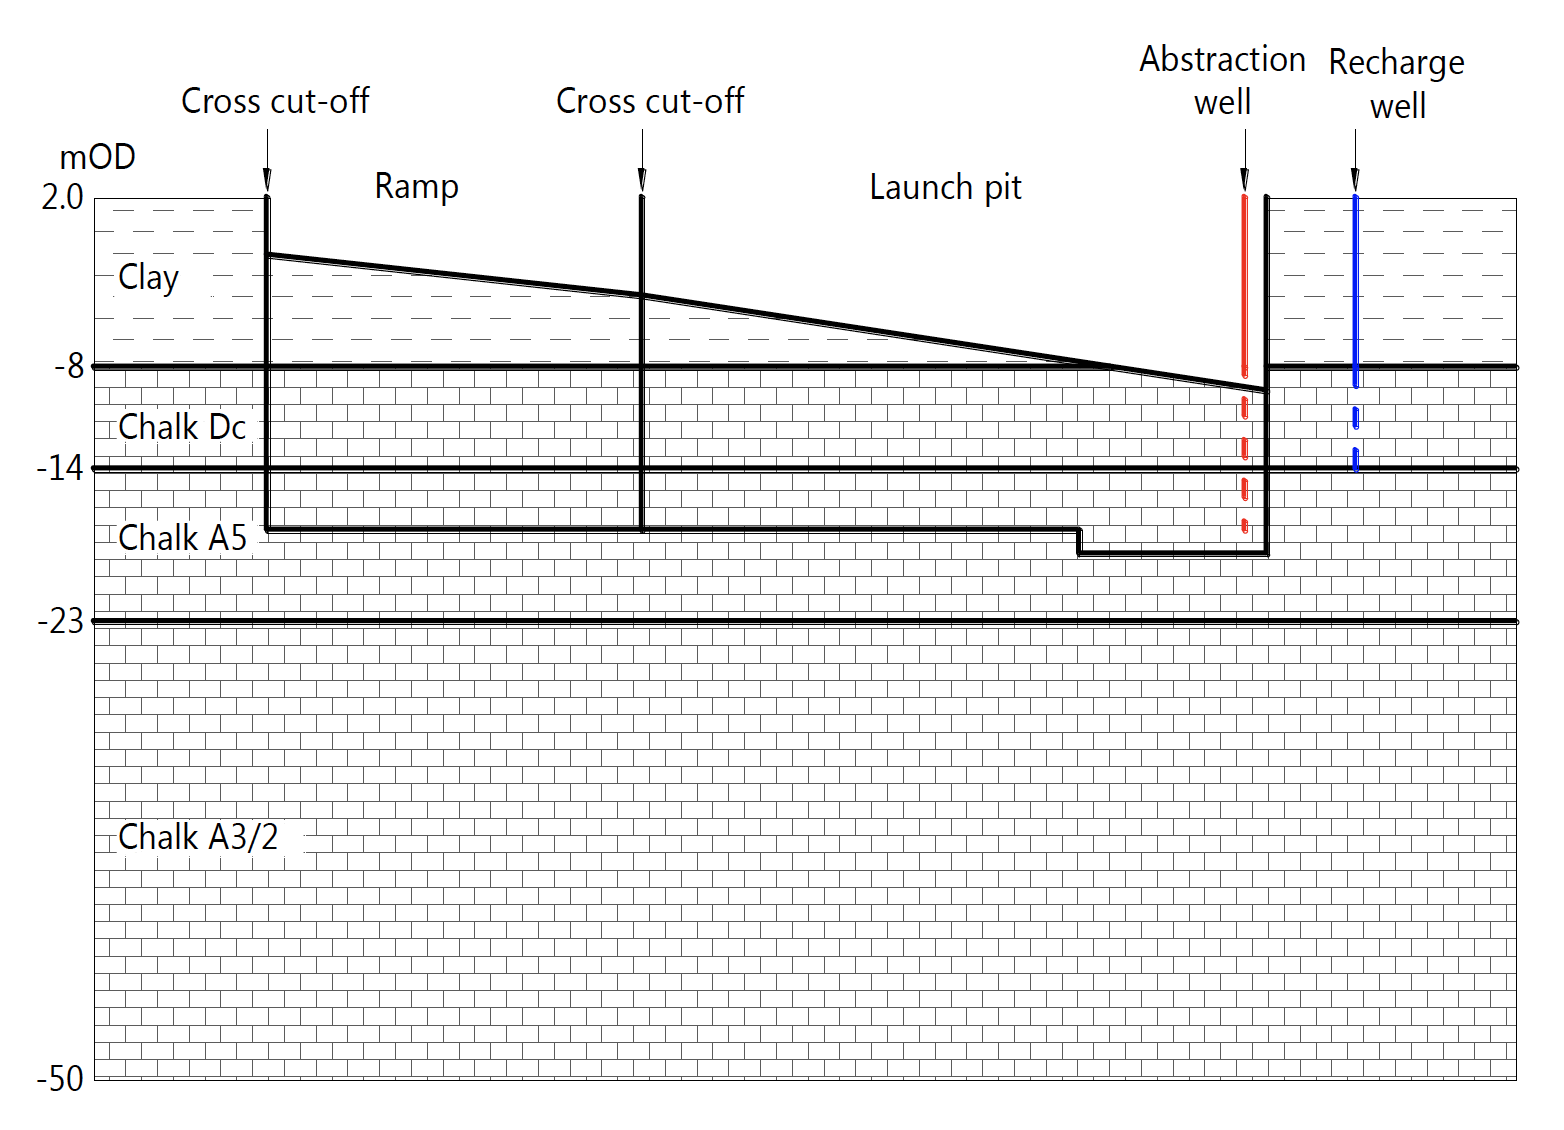
Figure 5: Numerical model cross-section.
Model Output
The base case model of the main works cofferdam used the design cut-off level and the permeability values given in Table 4. Three further model runs were carried out to investigate the sensitivity of the results to particular situations or variations in some of the key input parameters as follows:
- Base case
- As base case with no recharge
- As base case with permeability of A5 chalk doubled
- As base case with interface level for Dc/A5 chalk lowered to -16.7 mOD
All model runs included 8 abstraction wells and 10 recharge wells with the layout generally as shown in Figure 6. Model Case 2 provides an indication of the impact of loss of recharge capacity. Case 3 investigates the impact of doubling the vertical permeability of A5 chalk, which is the most sensitive parameter in controlling inflows. The site investigation information suggested some variation in the interface level between the Dc/A5 chalk. The extent to which this may have reflected shortcomings in the method of drilling and logging was not clear. In addition there was some concern that hard driving might result in short piles. Case 4 was used to investigate the potential impact of both of these scenarios.
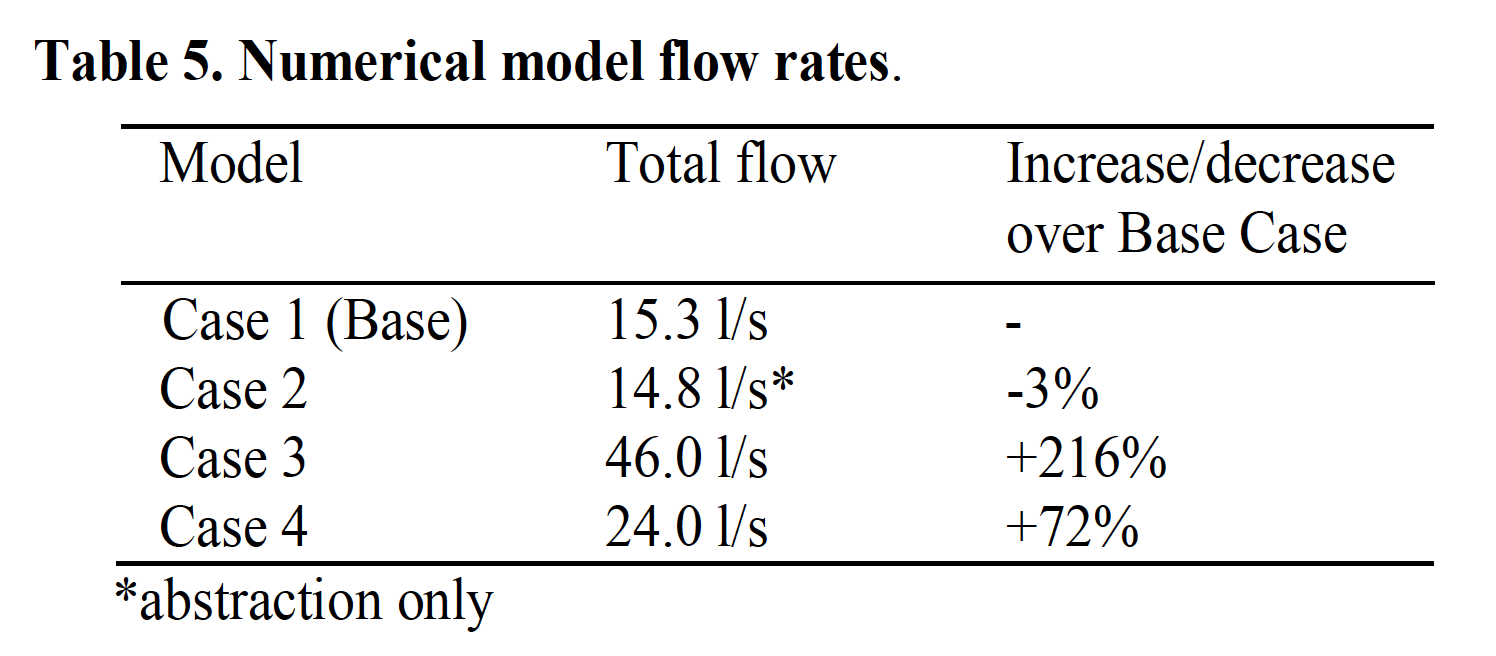
For all models the target drawdown inside the cofferdam was set to 1 m below dig level and apart from Case 2, 100% of the abstracted water was recharged. The model flow rates for each case and percentage variation from the base case is given in Table 5.
It is apparent that the abstraction flows are not sensitive to the rate of recharge. However, without recharge the external drawdown increased from approximately 0.1 m to 0.5 m. For Cases 3 and 4 the abstraction flow is appreciably greater, but the external drawdown is maintained at no more than approximately 0.1 m beyond the site boundary.
Scoping model runs confirmed that abstraction flow rates are relatively insensitive to reasonable variations in the permeability of either Dc chalk or the deeper A2/A3 chalk.
Dewatering System
The installed dewatering system comprised eight abstraction wells, five within the Launch Pit, and three within the Ramp Structure. In addition ten recharge wells were installed to the north and south of the structure, see Figure 6.
Both the abstraction and the recharge wells had response zones targeting the higher permeability Dc chalk (as PW1). The abstraction wells were sized to allow the installation of pumps of up to 10 l/s capacity as a contingency measure should the flow rates be higher than expected. The abstracted water was fed directly to the recharge wells with a header tank which would overflow to a surface water ditch drain if there was insufficient recharge capacity.
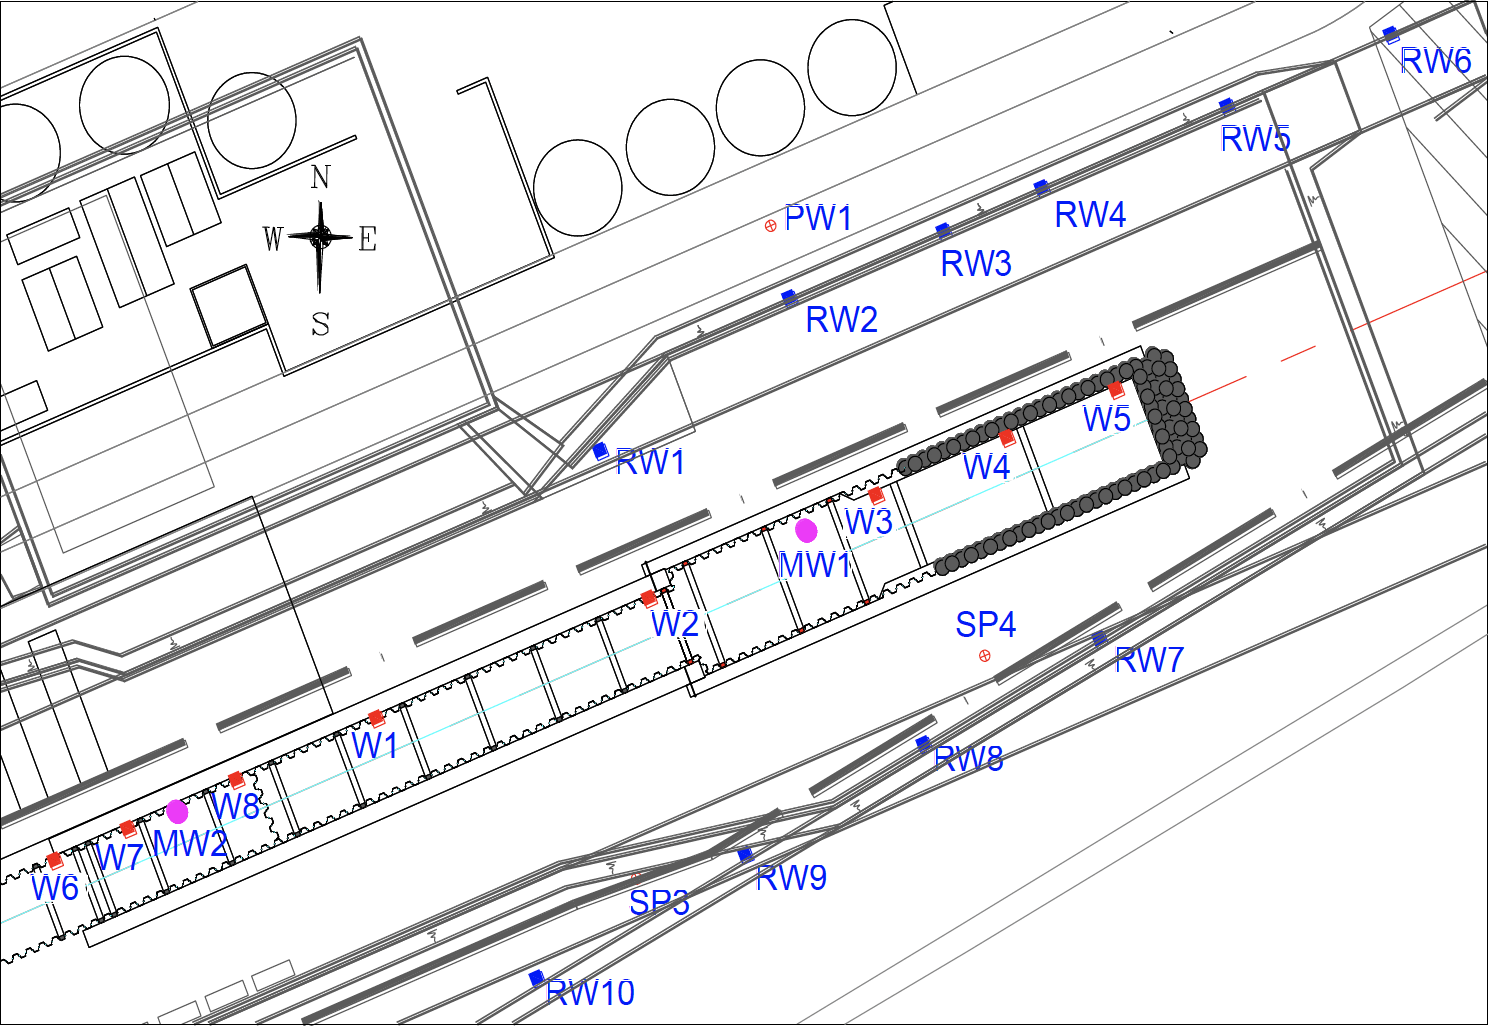
Figure 6: Dewatering Layout
Operation of Dewatering System
An array of piezometers was used to monitor water levels. This included internal piezometers to check that the target drawdown could be achieved and external piezometers to monitor the effects of the re- charge. In addition the existing array of far field piezometers allowed an assessment of any impact on neighbouring abstraction licence holders. These were also used for sampling to assess any impact on the water quality, particularly saline intrusion from the estuary.
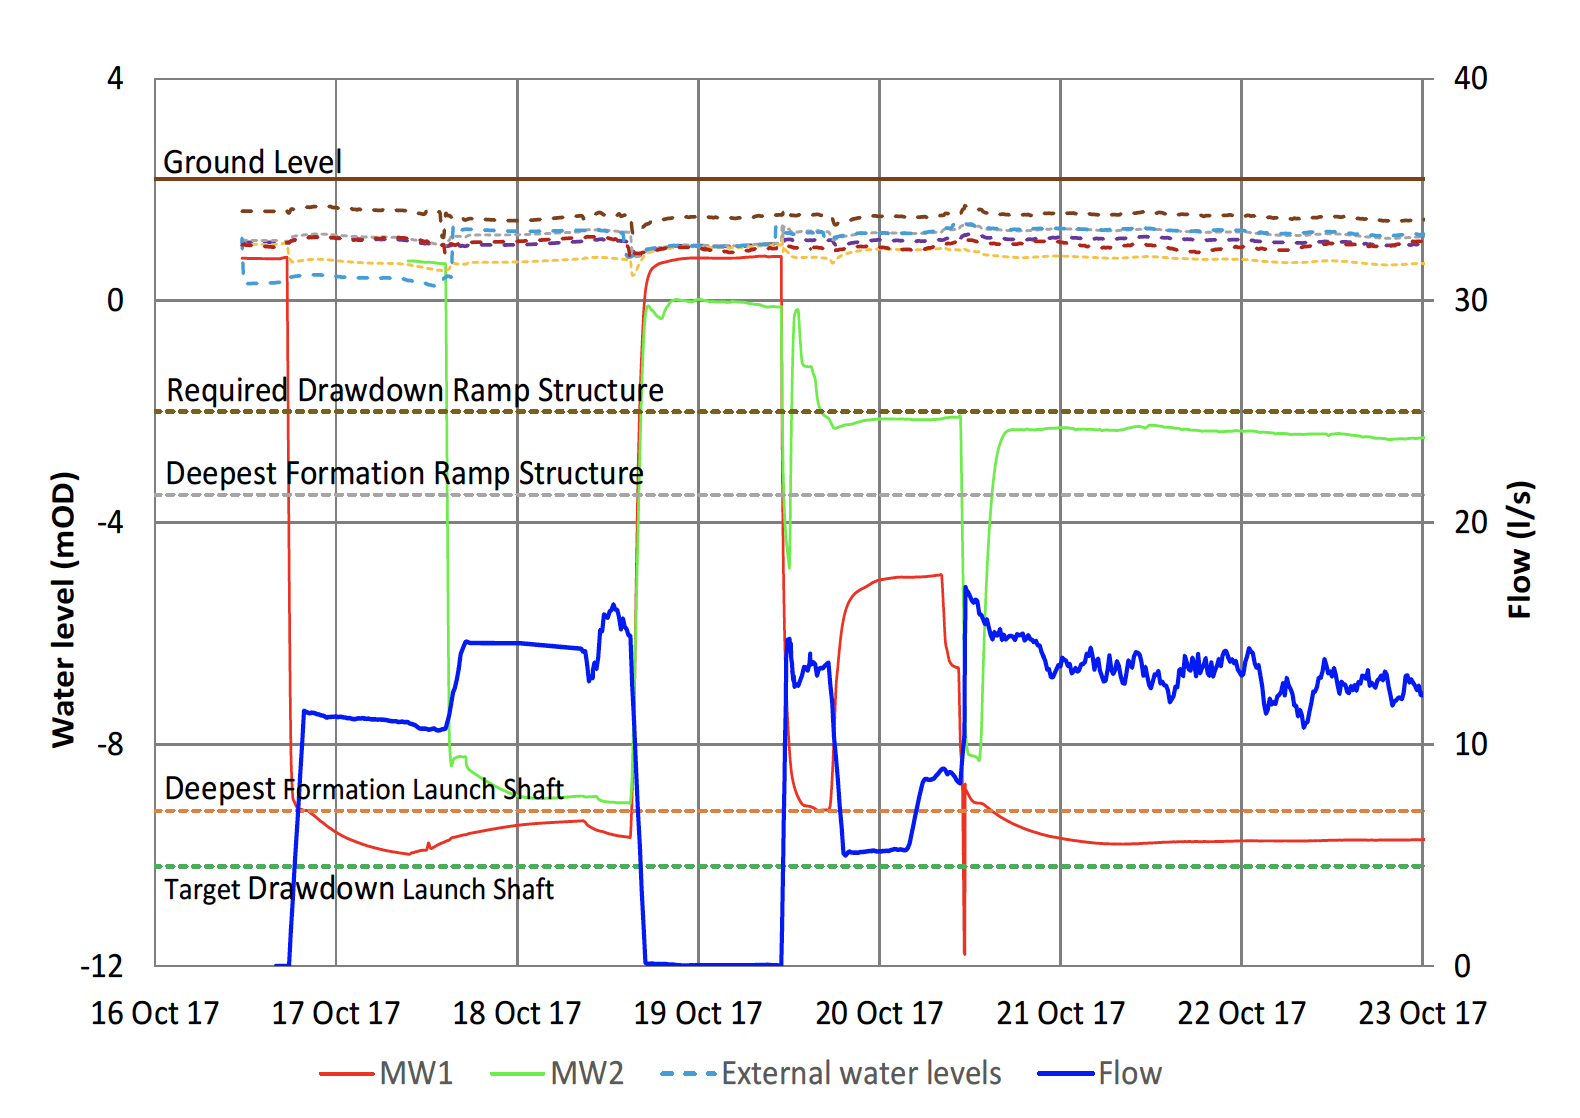
Figure 7: Site data from initial system operation.
The data gathered during the first week of operation are shown in Figure 7. The initial abstraction flow rate was approximately 12 l/s. The initial commissioning is represented by the period of relatively unstable flow as the dewatering system was trimmed and optimised to ensure the drawdown was achieved, and that the system was operating within consent constraints. A switch-off test was undertaken on 19 October which confirmed the expected rapid recovery in the event of an interruption to pumping. This reaffirmed the need for redundancy and automatic standby generator power supplies. Once this commissioning period was complete and the required drawdown levels had been established, the system was operating at an abstraction flow rate of just under 8 l/s which provides a comfortable margin relative to the base case model results. At all times during the project all of the abstracted water was recharged to the aquifer, with only a minimal rise in external water levels, typically 0.2 m – 0.3 m within the vicinity of the recharge wells; no discharges to surface waters was necessary.
Conclusions
A dewatering and recharge system has been successfully designed and installed to achieve the drawdown required and has been operated within the constraints applied by the regulatory authority for works within a relatively highly stressed aquifer system. Key to the scheme was the implementation and analysis of an abstraction recharge pumping test.
The test programme was designed to investigate the permeability profile through the chalk which cannot be reliably determined from borehole logs, soils descriptions or in situ tests in boreholes or piezometers.
In particular the test programme was designed to investigate the vertical permeability at the retaining wall cut-off design toe level which primarily controls inflow below a partially penetrating cut-off. The pumping test and modelling was also used to investigate the viability of recharge which was necessary as a means of water disposal, and as a means to mitigate against saline intrusion from the estuary or derogation of existing licensed abstractors in the vicinity.
The data obtained provided a useful insight into the local permeability profile in the Northern Province Chalk Group which has rarely been investigated and reported in such detail elsewhere.
Acknowledgements & References
Acknowledgements
The main contractor for the works was a joint venture, Humber Pipeline Tunnel (HPT JV), consisting of Skanska, Porr and A.Hak operating under a design and build contract. The design work was undertaken on behalf of HPT JV by WS Atkins. The specialist dewatering sub-contractor was WJ Groundwater.
References
BS5930:1999. Code of practice for site investigations, BSI, London.
Kruseman, G.P. and De Ridder, N.A. 2000. Analysis and Evaluation of Pumping Test Data, 2nd edition. Publication 47, International
Institute for Land Reclamation and Improvement, Wageningen, The Netherlands (ISBN: 90 70754 207).
Lord, J.A. Clayton, C.R.I. & Mortimer, R.N. 2002. Engineering in Chalk, CIRIA Report C574, CIRIA, London.
Link
To read the full, original published paper, please click on the link below: